 Like getting all the latest green news? Be sure to "Like" greenmomster on Facebook!
Here in greenmomster’s science class, we’ve covered many topics including endangered species, wildlife corridors, and biodiversity, but you may be wondering, “how do environmental managers come up with the numbers on which their decisions are based?” It turns out, there are many ways to calculate the size or activity of a population of organisms:
- If the organisms are relatively still, like oysters or dandelions, scientists will often use a “quadrat” or a sample area like a circle or square to estimate the number of individuals in a larger area. First, you lay down the quadrat. Next, you count the number of individuals in the quadrat. Repeat this procedure several times, and then do the calculation to get your estimate for a larger area.
- If the organisms have a tendency to move, sometimes scientists will conduct “mark-recapture” surveys. Let’s say they want to know how many box turtles are in an area. First the scientists set out traps to catch the box turtles. Then they mark the turtles they caught and set them free. When the scientist later catches more turtles, he or she checks to see whether the turtles are marked. That info (number of marked vs. number of unmarked) goes into a calculation to determine the population size.
- Another way to count individuals and determine any change over time is to walk a line or transect through an area over the course of a week, month, year, or longer. As the scientist walks along, he or she counts each individual of a species that is seen within a set distance (maybe 15 feet). Repeating this procedure over a long time can possibly tell a scientist if a change in population size is occurring over time or between different locations. I used this method when studying butterflies in butterfly gardens. My butterfly watching volunteers and I walked transects through over 100 gardens, once per week, for six months during each of two years – it gave us a great idea of which butterfly gardens attracted the most butterflies and which types of butterflies they attracted.
And what’s a scientist to do, if there aren’t any formally gathered data to be found? A recent study reported on in the the Fall 2013 issue of dukenvironment magazine showed that even antique menus can be helpful clues in determining historic fish stocks. The researchers took a look at the types of fish that were found on menus from restaurants in Hawaii in the early and mid-1900s: “The team’s analysis of 376 menus from 154 different restaurants showed that near-shore species such as reef fish, jacks and bottom fish, for example were common on Hawaiian menus before 1940, but by its statehood in 1959, they appeared collectively on less than 10 percent of menus sampled. Restaurants began shifting to serving large pelagic species, such as tuna and swordfish. By 1970, 95 percent of the menus contained large pelagics; inshore fish had all but disappeared.” The team then went on to try to come up with reasons for the shift – population? taste? technology? So creative!
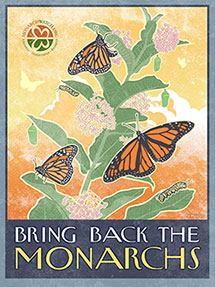 Could you be part of a scientific study? You bet! Many scientific studies that gather information on populations use “citizens scientists”. If you’re interested in getting involved, check out these interesting programs:
- Monarch Watch allows you to help count monarchs and track their North American migration
- Project Feeder Watch allows you to help count birds that visit your backyard feeders during the winter
- The Xerces Society has several opportunities for you to help monitor populations of dragonflies
- You can help the USGS monitor frogs in your area
Sources:
“Seafood Menus reflect long-term ocean changes.” Fall 2013. dukenvironment. p 12.
No comments:
Post a Comment